Research
Signal transduction in vertebrate photoreceptors
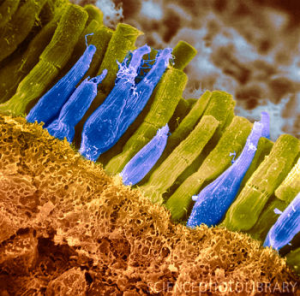
Vision starts when photons are absorbed in rod and cone photoreceptors in the retina. Phototransduction is the multistep process by which a photoreceptor converts light into an electrical signal (for reviews see [1–3]). There are two types of photoreceptors in the human retina: rods and cones (Fig. 1). Rods support monochrome vision in dim light (scotopic vision), whereas cones are responsible for color vision in daylight (photopic vision). Rods are so sensitive that they can reliably detect the absorption of a single photon in darkness [4]. The drawback of such high fidelity is that rods quickly saturate and stop working in daylight. Cones cannot detect single photons and are much less sensitive, but they adapt to light and never saturate, which ensures vision even under the brightest conditions.
Phototransduction remains at the forefront of signal transduction research, and despite intense efforts, the exact mechanisms governing the light response in rods and cones are not fully understood. To elucidate photoreceptor function and the impact of the biochemical pathway and the complex photoreceptor structure, we combine modeling with experiments by our collaborators (A.P. Sampath and G. Fain, UCLA). Based on electrophysiological data, we develop models and computer tools that simulate the photon response from the molecular level up. Such tools help, for example, to test molecular mechanisms behind photoreceptor degeneration (e.g. retinitis pigmentosa, loss of night vision) or to develop artificial retinas.
Modeling rod photoreceptors
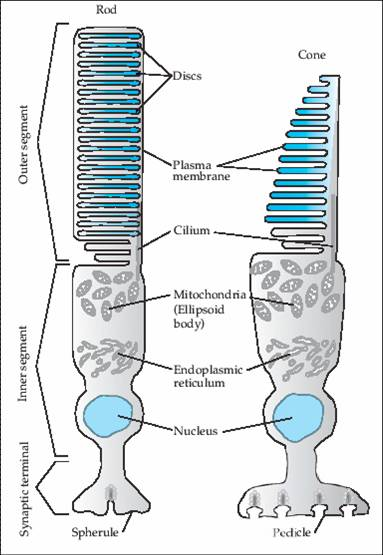
The outer segment (OS) is the sensory unit of a photoreceptor, where photons are absorbed and a photocurrent is generated (Fig. 2). The current flows into the inner segment, where it generates a voltage response that modulates vesicular release at the ribbon synapse. The rod OS is divided by around 103 internal disks into narrow, almost separate compartments. Absorption of a photon activates a rhodopsin molecule on the surface of an internal disk, which leads to the activation of many phosphodiesterase (PDE) molecules via a G-protein coupled amplification cascade. Activated PDE hydrolyzes cyclic GMP (cGMP), a second messenger that diffuses between the disks and gates ion channels in the membrane. A falling cGMP concentration closes channels and hyperpolarizes the photoreceptor.
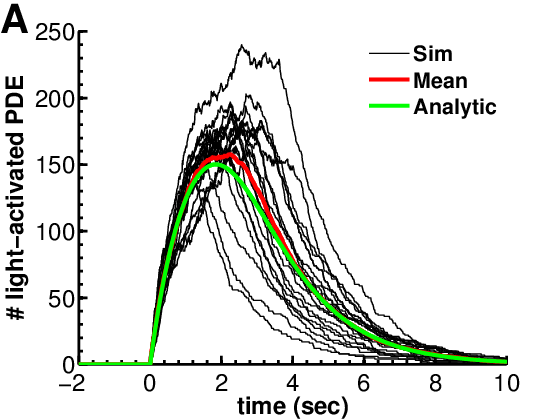
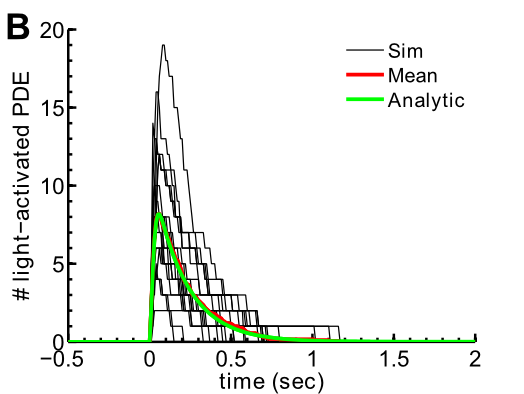
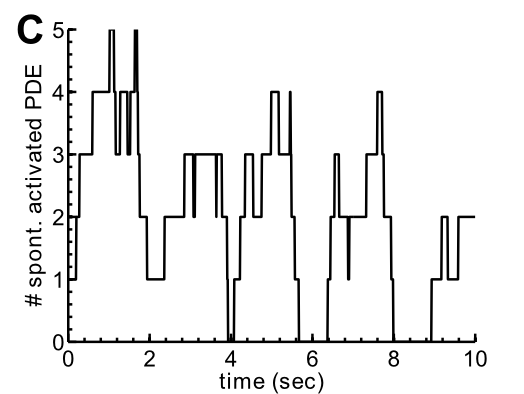
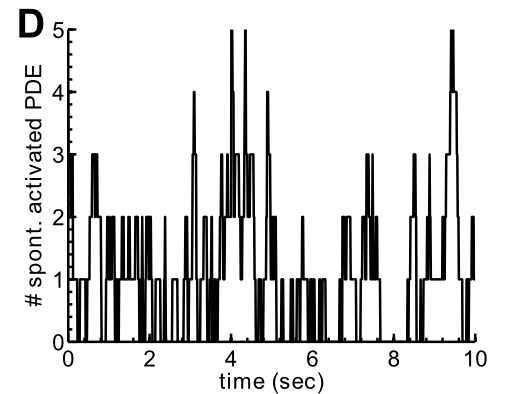
PDE has two essential functions. First, PDE activated through the G-protein cascade after a photon absorption (light-activated PDE) signals the light response (Fig. 3 A–B). Second, spontaneously activated PDE maintains a steady-state cGMP concentration in darkness and sets the cGMP turnover rate (Fig. 3 C–D). Fluctuations in the number of spontaneously activated PDEs generate a background noise known as dark noise [5]. Most of the variability of the single-photon response comes from variability in the numbers of light-activated and spontaneously activated PDEs.
Mean and variance of the number of light-activated PDE
We investigated PDE amplification gain and noise with a Markov model of the biochemical reactions, including rhodopsin deactivation via multiple phosphorylations [6]. In a mouse rod, a photon absorption activates on average only around 8 PDE molecules, because rhodopsin is deactivated within ~40 ms (Fig. 3B). In a toad rod, a much longer rhodopsin lifetime of ~2 s leads to around 100–150 activated PDE molecules (Fig. 3A). Contrary to common belief, a low variability of the activated rhodopsin lifetime is neither necessary nor sufficient for a low variance in the number of activated PDEs. The PDE noise depends significantly on whether PDE or rhodopsin deactivation is rate limiting [6].
Hydrolytic activity of light-activated PDE
Light-activated PDE is a highly efficient enzyme that hydrolyzes cGMP with a diffusion-limited rate constant, so the geometry of the OS strongly affects the hydrolysis rate. We estimated this rate by computing the encounter rate between cGMP molecules diffusing in the cytosol and activated PDE molecules on the surface of the internal disks in the confined rod geometry [7, 8]. We found a rate of around 2.9 s−1 for a toad rod and a much higher rate of around 60 s−1 for a mouse rod, due to its smaller diameter. Because the rate constant is so much higher in mouse, only a few light-activated PDEs per photon are needed for a response that overcomes background noise. As a consequence, activated rhodopsin can have a much shorter lifetime in a mammalian rod than in an amphibian rod, allowing much faster temporal resolution in mammalian rod vision [9].
Spontaneous PDE activation and deactivation
To detect a single photon, the amplification must be reliable and the signal must also rise above the background noise. In darkness, the major source of noise (dark noise) in a rod is the spontaneous activation and deactivation of PDE [5]. The noise level depends on the number of spontaneously activated PDEs in a compartment. Although PDE fluctuations grow as the mean grows, the current noise decreases because PDE hydrolyzes cGMP. More spontaneously activated PDEs reduce dark noise and give a better signal-to-noise ratio at the peak of the single-photon response. From a power spectrum analysis of the dark noise [8], we found that on average around 0.9 PDE are spontaneously active in a single mouse compartment, similar to around 1.2 in toad [5] (Fig. 3 C–D). Such a value is needed to reduce dark noise to a level where a single photon, causing only a 5–10% current reduction, is detectable [9].
Stochastic framework to simulate a photon response with intrinsic noise
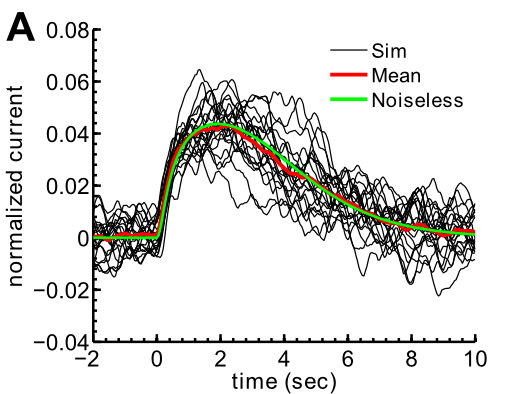
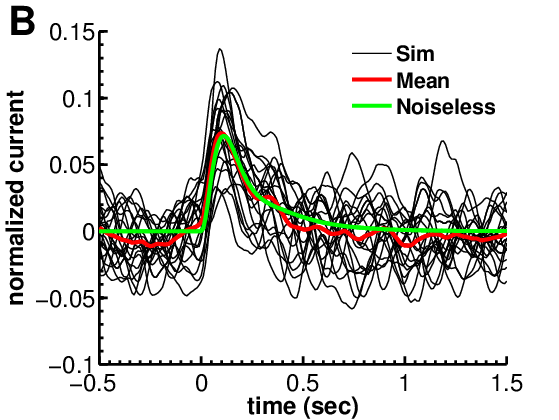
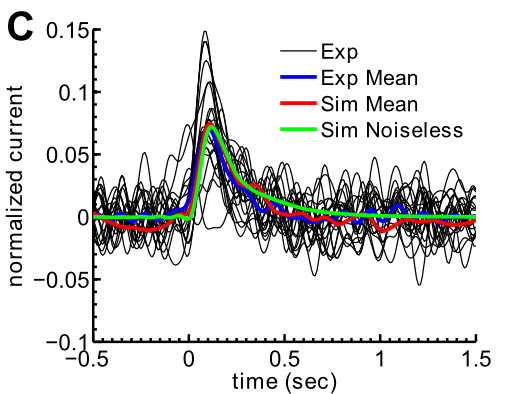
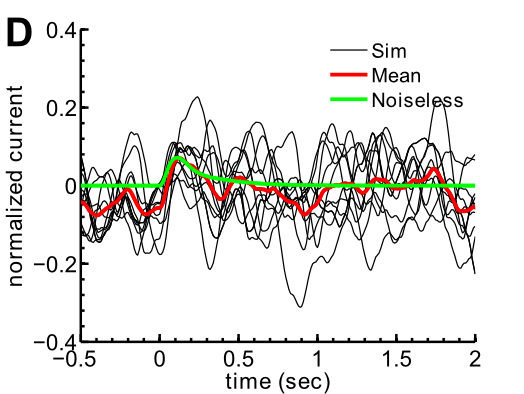
We developed a framework to simulate a single-photon absorption together with the intrinsic noise [9]. These simulations (Fig. 4 A, B) can be compared directly with experimental recordings (Fig. 4C). Assuming a transversally well-stirred OS, we reduced the full geometry to a one-dimensional model in which the 3D geometry enters through effective parameters. Each compartment is represented by coupled ordinary differential equations for cGMP and Ca2+, and compartments are coupled through effective longitudinal diffusion. To include intrinsic noise, we combined these reaction-diffusion equations with stochastic simulations of spontaneous and light-activated PDE in each compartment (Fig. 3).
Adaptation between biochemistry and rod geometry
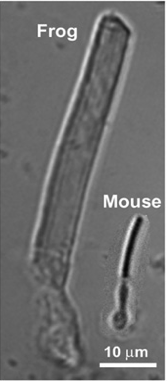
Mammalian rods are usually much smaller than amphibian rods (Fig. 5), and the mammalian photon response is much faster (Fig. 4 A–B). Can a functional mammalian-like rod be obtained simply by shrinking an amphibian rod? The answer is no: biochemistry and geometry must adapt together to preserve single-photon detection [9]. Because the hydrolysis rate is higher in a smaller outer segment, a mammalian rod needs fewer activated PDE molecules for a detectable single-photon response. The lifetime of activated rhodopsin can therefore be much shorter, giving a faster response and a shorter integration time. With an amphibian rhodopsin lifetime, far too many PDEs would be activated and the single-photon response would be greatly prolonged [9].
Shrinking the outer segment and shortening the rhodopsin lifetime is still not enough to turn an amphibian rod into a mammalian one. The PDE density and the catalytic activity of spontaneously activated PDE must also adapt [9]. In a smaller OS, the PDE density must increase to keep enough spontaneously activated PDEs for a low dark-noise level (Fig. 4D); indeed, PDE density is five times higher in mouse than in toad [1]. The catalytic activity of spontaneously activated PDE must also be adapted, by a mechanism that is currently unknown. If spontaneously activated PDE had the same diffusion-limited activity as light-activated PDE, the basal cGMP hydrolysis rate in mouse would be far too high and would reduce the amplitude of the single-photon response.
References
- E.N. Pugh Jr and T.D. Lamb. Phototransduction in vertebrate rods and cones: Molecular mechanism of amplification, recovery and light adaptation. Handbook of Biological Physics Vol. 3, Elsevier, Amsterdam, p. 183 (2000).
- F. Rieke and D. Baylor. Origin of reproducibility in the responses of retinal rods to single photons. Biophys. J. 75, 1836 (1998).
- M.E. Burns and V.Y. Arshavsky. Beyond counting photons: trials and trends in vertebrate visual phototransduction. Neuron 48, 387 (2005).
- J. Reingruber, D. Holcman, G.L. Fain. How rods respond to single photons: Key adaptations of a G-protein cascade that enable vision at the physical limit of perception. Bioessays 37(11), 1243 (2015).
- F. Rieke and D. Baylor. Molecular origin of continuous dark noise in rod photoreceptors. Biophys. J. 71, 2553 (1996).
- J. Reingruber and D. Holcman. The dynamics of phosphodiesterase activation in rods and cones. Biophys. J. 94(6), 1954 (2008).
- J. Reingruber and D. Holcman. Estimating the rate of cGMP hydrolysis by phosphodiesterase in photoreceptors. J. Chem. Phys. 129, 145102 (2008).
- J. Reingruber and D. Holcman. Diffusion in narrow domains and application to phototransduction. Phys. Rev. E 79(3), 030904 (2009).
- J. Reingruber, J. Pahlberg, M.L. Woodruff, A.P. Sampath, G.L. Fain, D. Holcman. Detection of single photons by toad and mouse rods. PNAS 110, 19378 (2013).
Signal transduction in olfactory receptor neurons
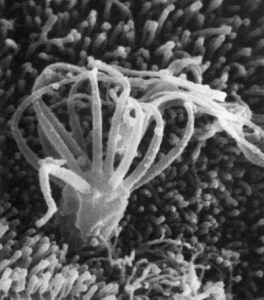
The sensory domain of an olfactory receptor neuron (ORN) consists of around 15 slender cilia (less than 200 nm in diameter) embedded in a thin mucus layer on the surface of the olfactory epithelium in the nasal cavity (Fig. 1 and Fig. 2A). Odorant receptor activation in the membrane initiates a biochemical cascade that generates a depolarizing inward current through two types of ion channels [1, 2] (Fig. 2B). The cilia end in the dendritic knob, from where the summed current of all cilia flows via the dendrite to the soma and generates action potentials. Odorant detection is challenging because it must work in a mucosal environment exposed to the outside world, where ionic conditions can vary considerably over time and can be altered, for example, by parasympathetic activity. Further variability comes from the expressed odorant receptor (around 350 types in humans).
Signal transduction also takes place in tiny cilia, where even small currents strongly change internal ion concentrations and the membrane potential. Currents can rapidly shift reversal potentials and thereby change electrical driving forces. A peculiar feature of olfaction is that transduction first opens CNG channels, causing Na+ and Ca2+ influx; the Ca2+ then produces further excitation by gating Ca2+-activated Cl− channels, Anoctamin 2 (Ano2) [4]. Because Cl− carries up to 90% of the excitatory odor-evoked current [5], Ano2 was long thought to be the main channel for amplification and odor detection. This view has recently been challenged [6], raising the question of what role Ano2 and the large Cl− current play.
Electrodiffusion model with signal transduction and ion dynamics in a cilium
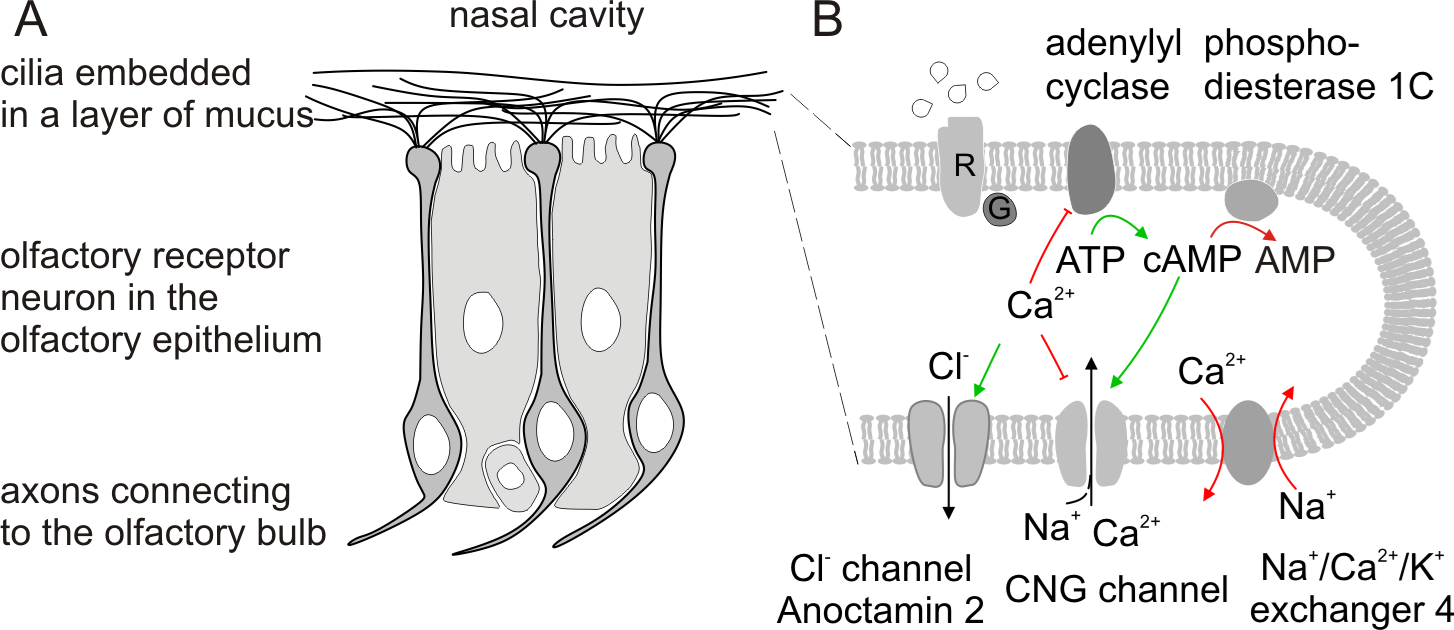
Together with electrophysiological recordings from the group of J. Reisert (Monell Chemical Senses Center, Philadelphia, USA), we use modeling to study the olfactory response. A key aspect is the complex ion dynamics (Na+, K+, Ca2+, Cl−) in the small ciliary space, driven by ion fluxes between cilia, mucus and cell body. We developed a mathematical model based on electrodiffusion and Nernst potentials that includes the signal transduction pathway and the ion dynamics in mucus, cilia and cell body. It accounts for CNG and Ano2 channels and for the Na+/Ca2+/K+ exchanger 4 (NCKX4), which is integral to ciliary homeostasis [7]. The simulations show to what extent the ion dynamics in the confined ciliary space, versus the transduction pathway, shape the current response.
References
- Kleene, Chem. Senses 33(9), 839–859 (2008).
- Reisert, Tutorials in Mathematical Biosciences II, Lecture Notes in Mathematics 1867, 155–171 (2005).
- Reisert, J. Gen. Physiol. 136(5), 529–540 (2010).
- Stephan et al., PNAS 106(28), 11776–11781 (2009).
- Reisert et al., J. Gen. Physiol. 122(3), 349–363 (2003).
- Billig et al., Nat. Neurosci. 14(6), 763–769 (2011).
- Reisert et al., Neuron 45(4), 553–561 (2005).